
Genmab strong outperformer in European pharmaceutical sector
In the recent years Genmab had a very positive price momentum. Because of the huge return over the past 5 years of 484 percent the share belongs to the top of the pharmaceutical companies. Shares of the sector delivered the past 5 years a gain of at around 255 percent.
Momentum pharmaceutical sector
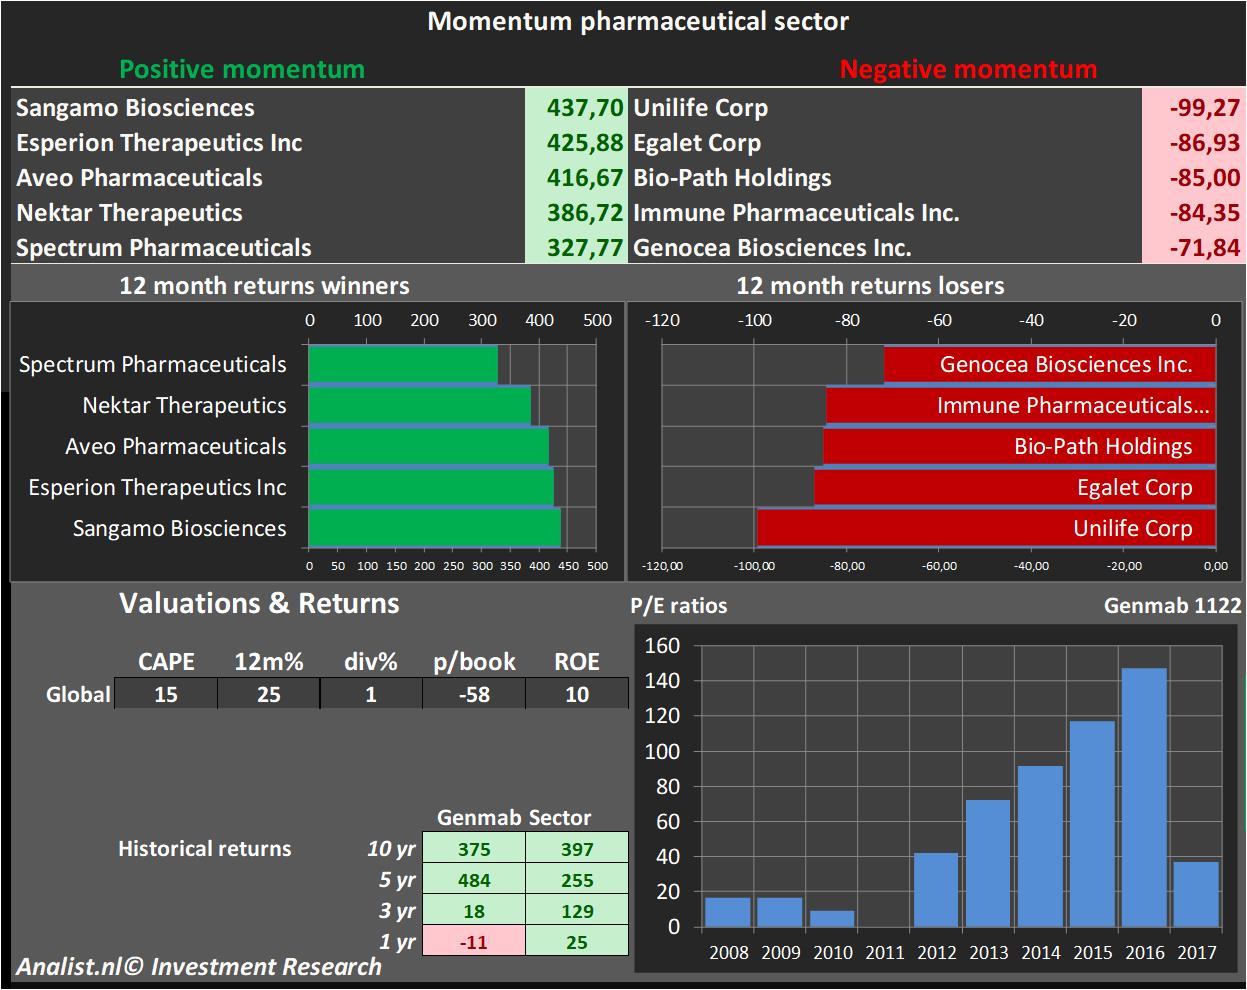 The sector trades now at 10 times the earnings per share. The sector trades now at -58,13 times the book value per share. Since 2012 the sector has a profit of 255 percent and since 2007 a profit of 397 percent.
 Over the current book year the total revenue will be 4,69 billion Danish Krone (consensus estimates). This is rather significant more than 2017's revenue of 3,03 billion Danish Krone.
Historical revenues and results Genmab plus estimates 2018
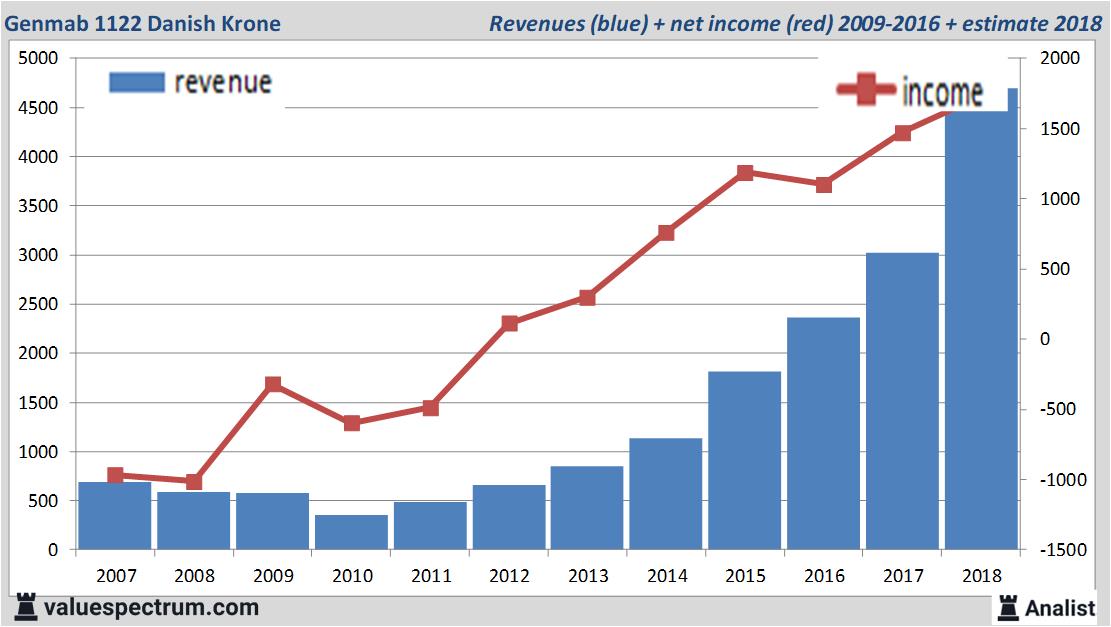
The analysts expect for 2018 a net profit of 1,73 billion Danish Krone. For this year the consensus of Genmab's result per share is a profit of 28,67 Danish Krone. The price/earnings-ratio is then 39,13.
For this year analysts don't expect the company to pay a dividend. The average dividend yield of the pharmaceutical companies is a limited 0,5 percent.
Genmab's market value equals around 68,54 billion . The Genmab stock was the past 12 months quite unstable. Since last April the stock is 11 percent lower. This year the stock price moved between 786 and 1335 DKK. Since 2008 the stock price is almost 375 percent higher.
Historical stock prices Genmab
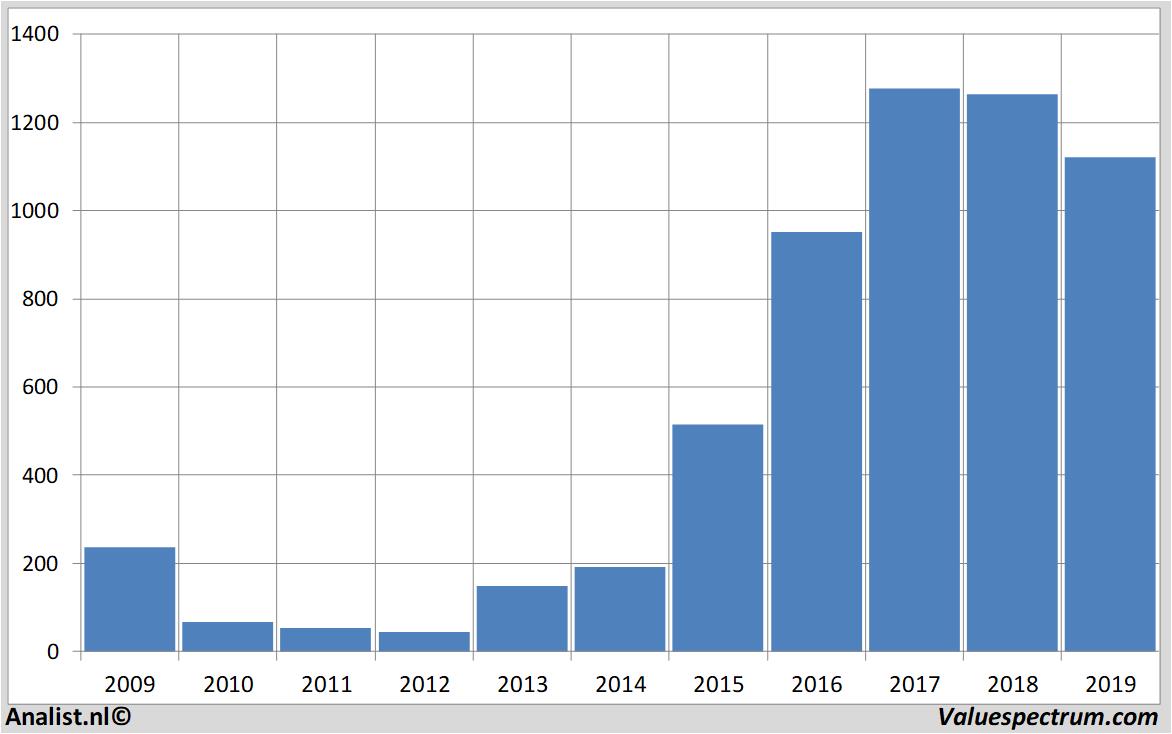
On Wednesday the stock closed at 1122 Danish Krone.
ValueSpectrum.com News Wire & Equity Research: +31 084-0032-842
news@valuespectrum.com
Copyright analist.nl B.V.
All rights reserved. Any redistribution, duplication or archiving prohibited. analist.nl doesn't warrant the accuracy of any News Content provided and shall not be liable for any errors, inaccuracies or for any actions taken in reliance thereon.
| About us | Network | Partners |
| Fpgroup.nlinfo@analist.nlRSS feedContactIntellectual Property Photos |
Analist.nlLinksISIN
|
MorningstarPrudena.comAAII.comNASDAQvwd GroupEuronextBATS Chi-x |